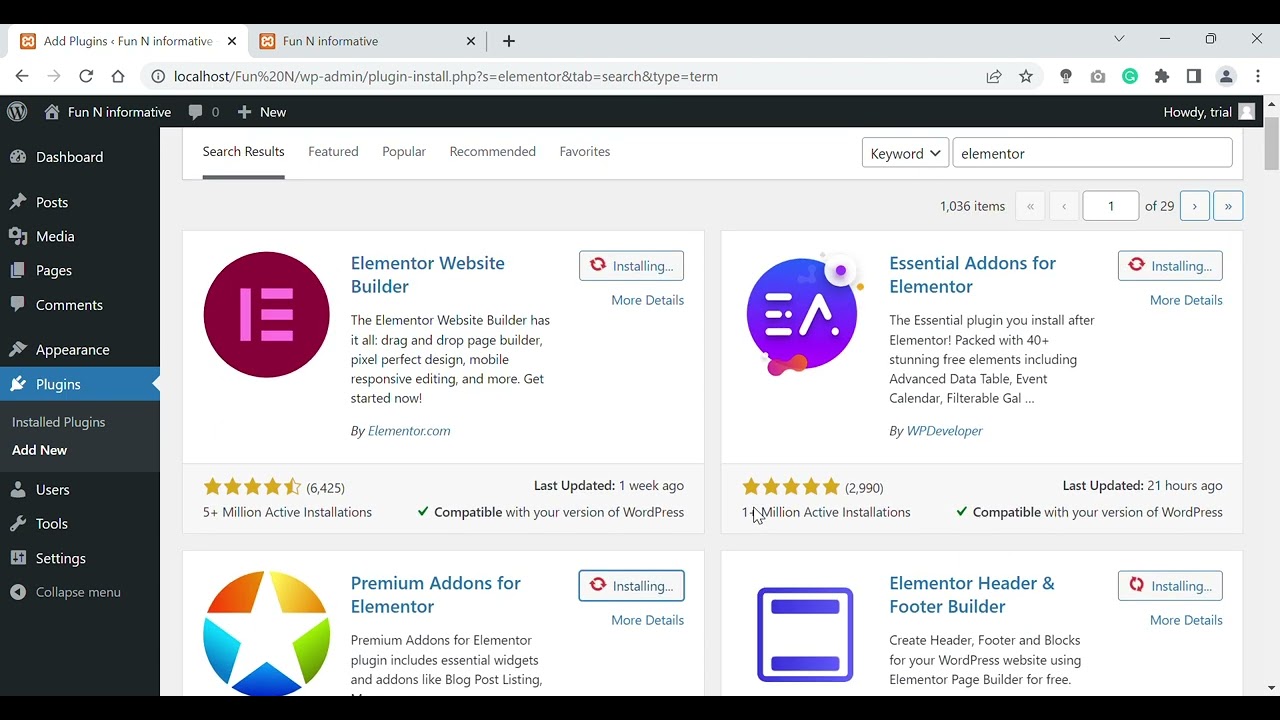
You can add Google Analytics to your site by adding a small snippet of code provided directly before the closing tag of each page. If you’re using a CMS like WordPress, there are free plugins that will do this for you automatically. Otherwise, you will need to work with the your web designer to have the code added manually.
Once installed, Google Analytics collects data continuously though the reports are only updated every 24 hours. After logging in and selecting your site, the first screen is the Dashboard. The simple interface belies an extremely powerful reporting system capable of crunching a large amount of data. Covering every feature would take an entire book, but here are the major parts for beginners.
Dashboard
The dashboard contents can be customized by dragging panels around or deleting them entirely. The default setup includes:
- The date range, which can be changed to show any period since Analytics starting collecting data for the site.
- Visits: measures the total number of visitors to the site each day. Clicking the drop-down allows you to graph one of 5 other measures represented in Site Usage below, or compare two measures against each other.
- Site Usage: shows visits, total page views and pages per visit. The bounce rate indicates the percentage of visitors who left the site after viewing only one page. The average time on site excludes bounces since there’s no way to measure the time spent if a user left immediately. New visits shows the percentage of visitors who had not visited the site previously. You can click any other of these six measures to drill down into more detail.
- Map Overlay: illustrates the geographic source of the visits. Click ‘view report’ to drill down further, showing state and city-level visitor information.
- Traffic sources: breaks down the visits into Direct (the URL was entered directly), Organic (it was followed from a search engine result), and major referral sites that have links to your site. The full report shows referral sites in more detail.
- Content overview: shows the most popular pages at a glance, based upon the number of pageviews.
- Export/email: here you can export reports or send emails either on a once-off basis or scheduled at regular intervals.
Visitors menu
Click Visitors on the left to open the submenu of options. There is a considerable amount of data here with some of the main highlights including:
- Technical information: the usage of different browsers, the connection speed of your users, their operating system, screen resolutions and support for features such as Java and Flash.
- Benchmarking: illustrates how your site compares to sites of a similar size.
- Trending and loyalty: over time this builds a picture of whether measures are improving or not, while loyalty shows the number of visitors who have visited n times, their length of visit and the depth of their search (how many pages were viewed).
Content menu
These reports are a gold mine for SEO opportunities, directly linking search terms with landing pages and user behavior. Some important parts include:
- Top content: the pages receiving the most number of pageviews.
- Navigation summary: how visitors moved around your site, where they came from and what they did next. There is also an entrance path analysis which shows the same for each page.
- Top landing pages: while most visitors likely arrive at the home page, high-ranking pages within your site will attract their own visits from organic search results (these are called landing pages).
- Top exit pages: discover which pages are making visitors leave the site. Ideally, an order confirmation page should have a high exit rate, while a shopping cart summary would be low.
- Entrance keywords: the most popular keywords and phrases that drew visitors to your site or specific webpage. The most successful phrases may not have been one you were intentionally targeting.
- Site Overlay: shows your site’s home page and overlays click percentages, indicating which hyperlinks visitors followed.
Unlike any other analytics package, Google Analytics also provides deep integration with Google AdSense. This means you can incorporate cost-per-click pricing into this data, helping to produce an extra layer of information in calculating the return on investment for paid search. In other words, putting together the cost of getting a click with what the visitor did after arriving on your site.
Once you get started with Google Analytics, the features are practically limitless – A/B testing (showing different content to different visitors and comparing results), goal setting and intelligence reports and just some of powerful tools that give you an comprehensive insight into your web performance.
For an indepth view of Google Analytics, I’d recommend reading Google Analytics, 3rd Edition.


